This is the 2D version of James Kent's wire test. This method is ineffective on slow and spherical mirrors, and on the inner zones of all mirrors. Let's say you are testing a paraboloid telescope mirror. If you hold your eye close behind the reflection of a pinhole, you see the mirror illuminated. Hold your arm out in the way, and you see the shadow. Move it closer, and you can see the shadow of a large spot on the glass slide you are holding in your hand.
Keep that in the center and bring it closer, until you see the very small spot next to it. Center that and bring it closer. You should see that the dark spot has a bright spot in the center. Keep it centered, slowly bring it closer and pretty soon it will get fuzzy. It gets larger and the central bright spot goes away. Now you are at the radius of curvature (ROC) of the central zone.
As you move the spot away from the mirror the shadow moves through each zone on the mirror, until you get to the very edge zone. After that and you are beyond the ROC of all of the zones of the mirror. When you move away from the center zone the spot becomes a small smudge surrounded by a dark ring. Any deviation of this ring from perfect roundness is astigmatism in that zone.
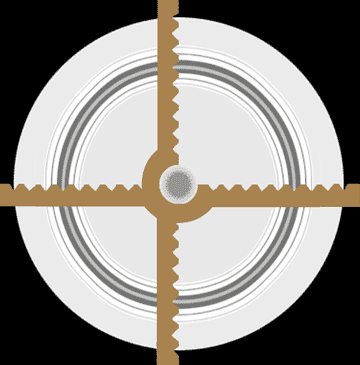
It is also possible to measure where the shadow passes through each zone with a pin/notch stick or even a Coudé-style mask. A two-way notchstick, having both horizontal and vertical notches, allows you to look for astigmatism carefully and measure zone radii at the same time. It's best to cut a round central zone, so that you can be sure the shadow stays centered. This test requires only a good Z axis movement.
When I use a small enough pinhole (smaller than 0.005"), then the effect is similar to that seen in the image above. The dark ring is split into two thin dark rings by a bright ring. This bright ring marks the zone at the center of the spot (which remains out of focus in the center). I also see diffraction effects around both edges of the dark ring. The smaller the pinhole gets the more dramatic the diffraction effects are.
For a parabola you use the formula r2/2R ({radius of the zone squared} divided by {2 times the ROC of the mirror}) to learn the ROC of each zone along the Z axis, relative to the center zone. Using a notchstick I have measured zones on my old 22" f/4.5 with the knife and with the bright ring, and I get about the same result with either tool. Using the spot seems to be more effective than the knife edge in the outer zones because the rings are symmetrical and easy to judge.
The spot blocks the light from the zone, the center, and nothing else. The bright ring is narrow and easy to mark with a notchstick, the diagram above shows it at the 70% zone. You would write down the micrometer reading, move the spot along the optical axis until the ring gets to the next zone, write down the reading, and move on to the next zone, etc, like you usually do.
A mask full of holes works as a two dimensional Coudé mask, you can take measurements across the mirror. The holes can be of a size, shape, position and number to suit you. The mask in the second drawing shows an enlarged center hole to make sure the spot stays centered. There are currently six holes (zones) with the ring shadow centered under them. You would record the axial position of the spot and note which holes it aligns on. Then move the spot a bit farther along the optical axis until the ring is centered in another hole(s), and record the numbers. This is a bit tedious, but a significant amount of information can be learned from it.
In 2011 Jeff Baldwin decided to use this test on a 24" F/3.6
mirror he was making. He constructed a data sheet in Excel to input the data into.
I converted his spreadsheet into what you see below. He used the same mask pattern
which I used in 2003 when I made the image up above. I have made this
webpage application such that you can use it for any paraboloid mirror, as long as you use the same
mask pattern. Just enter your own data in place of Jeff's default data.
You must accurately know the distance from the center of each hole
to the center of the mask's central hole (the radius of the zone). And you must
accurately place the mask
on the mirror. The image on the left has the zones labeled
for you. You will notice that the spot is in zone E, so you would record that position
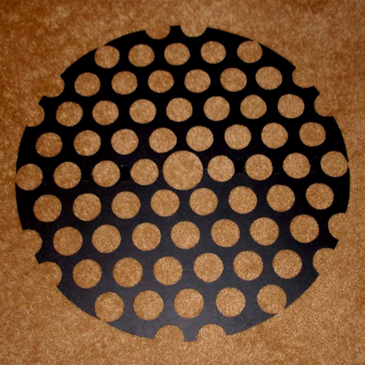
in the spaces below. The image on the right is a photo of Jeff's well-made mask
(photo by Jeff "Baldy" Baldwin, used with permission). Notice that zone "I" is right
on the edge of the mirror, and may or may not be useful, depending on your ability
to get good measurements there. All readings are in inches!
STEP ONE: In these two tables, enter your own numerical data in the yellow boxes, in inches, then click
the ( --> Calculate <-- ) button:
Mirror Diameter
Zone
Radius
r2/2R
R.O.C.
A
Focal Length
B
Focal Ratio
C
ρ
D
Rρ
E
2R
F
G
H
I
STEP TWO: Be sure to replace the default zone letters as you enter your readings in the
yellow boxes, using the 0.123 format, and then click the ( --> Figure <-- ) button:
CENTER
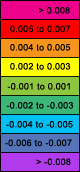
STEP THREE: The numbers in the boxes below show how far your readings differ from the ideal readings. If any boxes have NaN, that means you did not enter a number in that box, or you did not select and replace the default zone letter. The boxes form a color-contoured representation of your mirror. Each zone is colored relative to what it is supposed to be.
There is a scale bar on the right showing that magenta / reds are zones where the ROC is longer than desired, and blues / purple are the zones where the ROC is shorter than desired. Note that these colors do not necessarily show high and low areas on the glass. To visualize whch areas are high, and which are low, try this: Starting from the center and moving out, if the ROC is longer than desired, that is a low area - and if the ROC is shorter than desired, that is a high area. If you had 0.002 on the first zone, you'd then need -0.002 in the next zone to get out of the low area and back to normal.
(EXAMPLE: Let's say you have a perfect parabola on the test stand, but it is a thin mirror
and you are having a problem with your stand. The mirror is facing horizontal, and
it is resting on two side pegs. You might expect to see a local deformation where
the pegs are. You will probably also get a gravitationally-caused potato-chipping
effect where the top of the mirror bends forwards. These two effects are shown in
my sample data example.
to get my sample measurements into the yellow boxes above and to see the sample output below. Notice that the effect of these errors causes the ROC of the horizontal diameter to increase as the vertical diameter's ROC decreases, so if you did not know what was happening, you could measure a perfect parabola with a Foucault test and think it was a poor mirror.)
CENTER
STEP FOUR: You can place a mask over the colored boxes to help you visualize the surface. Click the button to show the mask, then click the mask to hide it again. You'll have to use the scrollbar to center the image under the mask. This feature does not work perfectly in all browsers.

 Keep that in the center and bring it closer, until you see the very small spot next to it. Center that and bring it closer. You should see that the dark spot has a bright spot in the center. Keep it centered, slowly bring it closer and pretty soon it will get fuzzy. It gets larger and the central bright spot goes away. Now you are at the radius of curvature (ROC) of the central zone.
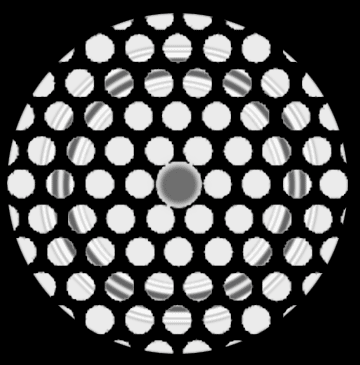 For a parabola you use the formula r2/2R ({radius of the zone squared} divided by {2 times the ROC of the mirror}) to learn the ROC of each zone along the Z axis, relative to the center zone. Using a notchstick I have measured zones on my old 22" f/4.5 with the knife and with the bright ring, and I get about the same result with either tool. Using the spot seems to be more effective than the knife edge in the outer zones because the rings are symmetrical and easy to judge.
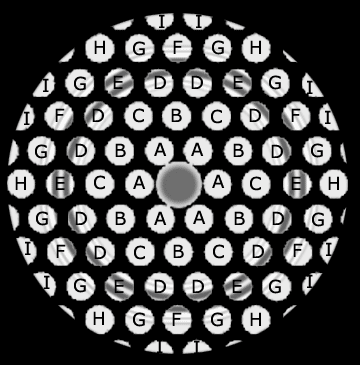
 STEP THREE: The numbers in the boxes below show how far your readings differ from the ideal readings. If any boxes have NaN, that means you did not enter a number in that box, or you did not select and replace the default zone letter. The boxes form a color-contoured representation of your mirror. Each zone is colored relative to what it is supposed to be.